Power BI for Business Intelligence is a powerful tool that revolutionizes data analysis for businesses of all sizes, providing a comprehensive solution for turning raw data into actionable insights. From visualizing complex datasets to streamlining reporting processes, Power BI offers a dynamic platform that empowers organizations to make informed decisions based on data-driven intelligence.
In this article, we will explore the key features of Power BI, its importance in different industries, and how it can enhance business performance through effective data visualization and analysis.
Introduction to Power BI for Business Intelligence
Power BI is a powerful business analytics tool developed by Microsoft that allows organizations to visualize and analyze their data in a more efficient and meaningful way. It plays a crucial role in Business Intelligence by enabling companies to make data-driven decisions and gain valuable insights from their data.
Using Power BI for data analysis in businesses offers numerous benefits, such as:
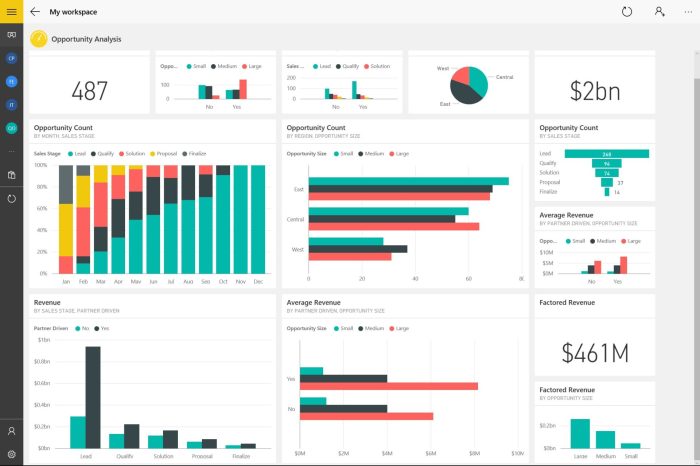
– Real-time data visualization: Power BI allows users to create interactive dashboards and reports that provide real-time insights into key metrics and performance indicators.
– Data integration: Power BI seamlessly integrates with a wide range of data sources, including Excel, SQL databases, and cloud services, making it easy to bring all your data together in one place.
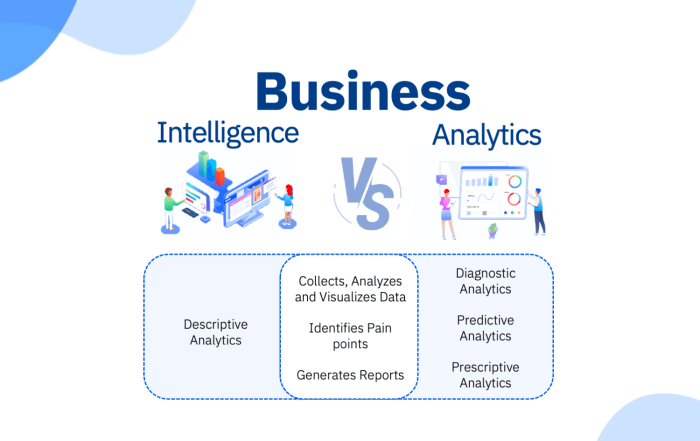
– Advanced analytics: Power BI offers advanced analytics capabilities, such as predictive modeling and machine learning, to help businesses uncover hidden patterns and trends in their data.
Various industries and sectors can benefit from using Power BI, including:
– Retail: Retailers can use Power BI to analyze sales data, track inventory levels, and identify customer buying patterns to optimize their operations.
– Healthcare: Healthcare organizations can leverage Power BI to analyze patient data, track medical outcomes, and improve decision-making processes.
– Finance: Financial institutions can use Power BI to monitor market trends, analyze investment portfolios, and generate financial reports with ease.
Enhanced Data Visualization
Power BI’s intuitive interface and customizable visualizations allow users to create compelling charts, graphs, and maps that help communicate insights effectively.
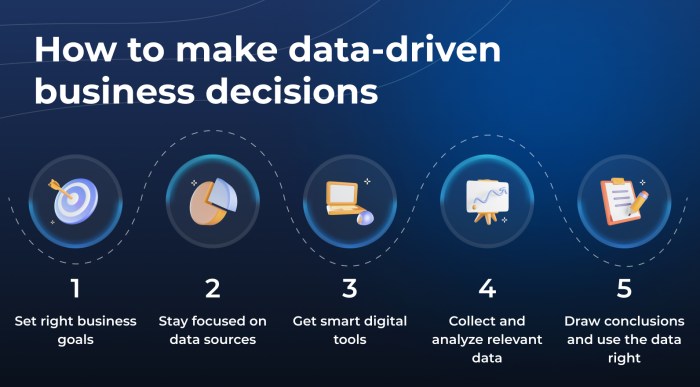
Data-driven Decision Making
By harnessing the power of Power BI, businesses can transform raw data into actionable insights that drive strategic decision-making and improve overall performance.
Key Features of Power BI
Power BI is a powerful business intelligence tool that offers a wide range of features for data visualization, analysis, and reporting. Let’s explore some of the key features that make Power BI a popular choice among businesses.
Data Visualization, Power BI for Business Intelligence
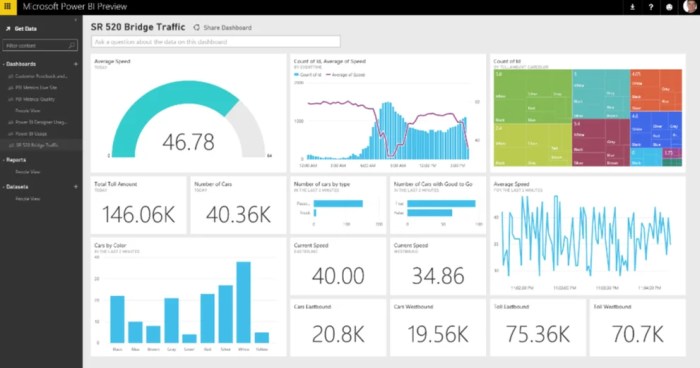
- Interactive Dashboards: Power BI allows users to create interactive dashboards with real-time updates, making it easy to monitor key performance indicators (KPIs) at a glance.
- Data Exploration: Users can easily explore and analyze data using interactive visualizations like charts, graphs, and maps, enabling better insights and decision-making.
- Custom Visualizations: Power BI offers a wide range of customizable visualizations and the ability to create custom visuals using R or Python scripts.
Integration with Microsoft Products
- Excel Integration: Power BI seamlessly integrates with Excel, allowing users to import data from Excel spreadsheets, create reports, and visualize data using Power BI tools.
- Office 365 Integration: Users can share Power BI reports and dashboards through Office 365 applications like SharePoint, Teams, and OneDrive, facilitating collaboration and data sharing within organizations.
- Azure Integration: Power BI can connect to Azure services like Azure SQL Database, Azure Data Lake, and Azure Blob Storage, enabling users to access and analyze data stored in the cloud.
Power Query and Power Pivot
- Power Query: Power Query is a data transformation tool in Power BI that allows users to connect, transform, and clean data from different sources before loading it into Power BI for analysis.
- Power Pivot: Power Pivot is a data modeling tool that enables users to create relationships between different datasets, perform calculations, and create complex data models for in-depth analysis.
- Importance: Power Query and Power Pivot are essential components of Power BI that help users prepare and optimize their data for accurate and insightful analysis, ensuring data quality and reliability in reports and visualizations.
Data Sources and Connectivity in Power BI

Power BI offers a wide range of connectivity options to access and analyze data from various sources.
When it comes to Enterprise Business Intelligence software, companies are constantly seeking solutions that can provide them with valuable insights to make informed decisions. One popular option that many businesses turn to is Enterprise Business Intelligence software , which offers advanced analytics and reporting capabilities.
Types of Data Sources
- Excel spreadsheets
- SQL databases
- Cloud services like Microsoft Azure, Google Analytics, Salesforce, and more
- Web data sources
Connecting Power BI to Data Sources
Connecting Power BI to different databases or cloud services involves a few simple steps:
- Open Power BI and click on the “Get Data” option.
- Select the type of data source you want to connect to.
- Enter the required credentials or connection details.
- Load the data into Power BI for analysis and visualization.
Real-World Scenarios
Data connectivity in Power BI is crucial in various real-world scenarios, such as:
- Analysing sales data from a SQL database to track performance and trends.
- Integrating customer data from Salesforce to gain insights for marketing strategies.
- Combining data from different sources like Excel, cloud services, and databases for a comprehensive business intelligence dashboard.
Creating Reports and Dashboards in Power BI

Creating interactive reports and engaging dashboards in Power BI is essential for effective data visualization and analysis. By following specific design principles and utilizing the key features of Power BI, users can build dynamic and insightful reports to extract valuable insights from their data.
Design Principles for Effective Data Visualization
- Keep it simple: Avoid cluttered visuals and focus on conveying information clearly and concisely.
- Use appropriate visuals: Select the right chart types and graphs that best represent the data and facilitate understanding.
- Consistent formatting: Maintain consistency in colors, fonts, and styles across all elements of the report for a professional look.
- Emphasize key insights: Highlight important findings or trends by using contrasting colors or annotations.
Steps to Create Interactive Reports
- Connect to data: Import data from various sources into Power BI to start building your report.
- Create visuals: Drag and drop fields onto the canvas to create interactive charts, graphs, and tables.
- Add interactivity: Utilize slicers, filters, and drill-down capabilities to allow users to interact with the data dynamically.
- Add calculated fields: Enhance your reports by creating calculated columns or measures to derive additional insights.
Tips for Building Dynamic Dashboards
- Focus on user experience: Design dashboards with a clear flow and intuitive navigation for seamless interaction.
- Use tiles effectively: Organize visuals into tiles and utilize features like bookmarks to create a guided experience for users.
- Create KPIs: Incorporate key performance indicators to track progress towards specific goals or metrics.
- Utilize storytelling: Arrange visuals in a logical sequence to tell a compelling data-driven story and guide decision-making.
Power BI Desktop vs. Power BI Service

When it comes to Power BI, users often have to choose between Power BI Desktop and Power BI Service. Let’s compare the features and capabilities of these two options to help you make an informed decision.
Features and Capabilities of Power BI Desktop
- Power BI Desktop is a free application that can be installed on your local machine, allowing you to create interactive reports and dashboards.
- It offers advanced data modeling capabilities, enabling users to manipulate and transform data before visualizing it.
- Power BI Desktop is ideal for individual users or small teams who want to create and analyze data without the need for collaboration.
Features and Capabilities of Power BI Service
- Power BI Service, on the other hand, is a cloud-based platform that allows you to publish, share, and collaborate on reports and dashboards.
- It offers features like automatic data refresh, scheduled data snapshots, and data alerts for real-time monitoring.
- Power BI Service is great for organizations looking to share insights across departments and collaborate on data-driven decisions.
Advantages of Using Power BI Service for Sharing and Collaboration
- Power BI Service enables real-time collaboration, allowing multiple users to work on the same reports simultaneously.
- It provides a centralized hub for sharing insights, making it easier for stakeholders to access and interact with data visualizations.
- Power BI Service offers secure sharing options, ensuring that sensitive data is only accessible to authorized users.
Power BI Pro vs. Power BI Premium Subscriptions
- Power BI Pro is a subscription plan that provides individual users with advanced features like sharing reports and collaborating with colleagues.
- Power BI Premium, on the other hand, caters to larger organizations by offering dedicated capacity, enhanced performance, and advanced administration features.
- While Power BI Pro is suitable for small to medium-sized teams, Power BI Premium is designed for enterprise-level scalability and performance.
Unlock the full potential of your data with Power BI for Business Intelligence. By harnessing the capabilities of this innovative tool, businesses can gain a competitive edge in today’s data-driven landscape, driving growth and success through informed decision-making.
Business Intelligence technologies play a crucial role in helping organizations gather, store, and analyze data to improve their operations. By utilizing the right tools and platforms, businesses can harness the power of data to drive growth and profitability. Explore more about Business Intelligence technologies to stay ahead in the competitive market.
Curious about What is Business Intelligence and how it can benefit your business? Understanding the concept of Business Intelligence is essential for leveraging data to gain insights that can drive strategic decisions. Discover more about What is Business Intelligence and its significance in today’s data-driven world.