BI tools for data visualization are essential in unlocking the potential of data-driven insights. From defining BI tools to exploring their importance, this article delves into the world of data visualization tools that empower decision-making and analysis.
Types, key features, and best practices are all covered to provide a comprehensive guide for leveraging BI tools effectively.
Overview of BI tools for data visualization

Business Intelligence (BI) tools are software applications used to analyze, present, and visualize data in a way that helps businesses make informed decisions. In the context of data visualization, BI tools play a crucial role in transforming raw data into meaningful insights that can be easily interpreted by users.
Using BI tools for data visualization is essential as it allows organizations to uncover trends, patterns, and relationships within their data sets. This visual representation of data makes it easier for users to identify key insights quickly and make data-driven decisions. Additionally, BI tools enable users to create interactive dashboards, reports, and charts that can be shared across teams for better collaboration and understanding.
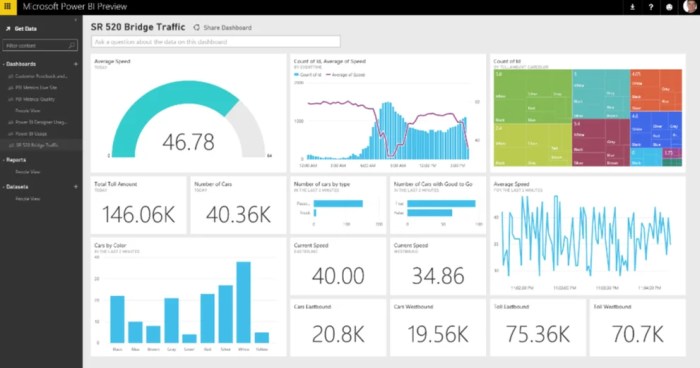
Some popular BI tools used for data visualization include Tableau, Microsoft Power BI, QlikView, and Domo. These tools offer a range of features such as drag-and-drop interfaces, data connectivity options, and advanced visualization capabilities to help users explore and analyze their data effectively.
Types of BI tools for data visualization

When it comes to Business Intelligence (BI) tools for data visualization, there are several types available in the market. Each type offers unique features and functionalities that cater to different data visualization needs. Let’s explore some of the key types of BI tools and compare their features.
1. Dashboarding Tools
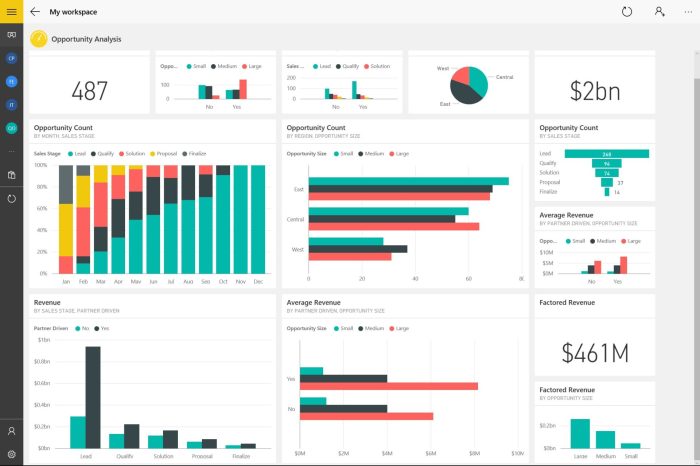
Dashboarding tools are designed to create interactive and visually appealing dashboards that display key metrics and KPIs. Examples of dashboarding tools include Tableau, Microsoft Power BI, and Google Data Studio. These tools allow users to build customized dashboards with drag-and-drop functionality, making it easy to visualize data in a concise and intuitive manner.
2. Reporting Tools
Reporting tools are focused on generating static or automated reports based on predefined parameters. Tools like SAP Crystal Reports, IBM Cognos Analytics, and Zoho Analytics fall into this category. Reporting tools are ideal for generating detailed reports with specific data sets, enabling users to analyze trends and insights over time.
3. Self-Service BI Tools, BI tools for data visualization
Self-Service BI tools empower users to independently access and analyze data without the need for IT support. Examples include Microsoft Power BI, Tableau Desktop, and Qlik Sense. These tools offer a user-friendly interface with advanced capabilities for data visualization, allowing users to create interactive charts, graphs, and dashboards on their own.
Each type of BI tool serves a specific purpose and caters to different data visualization needs. Dashboarding tools are great for real-time monitoring of key metrics, reporting tools are ideal for generating detailed reports, and self-service BI tools are perfect for users who want more control over their data visualization processes. Choosing the right type of BI tool depends on the specific requirements and goals of the organization or individual user.
Key features of effective BI tools for data visualization

Effective BI tools for data visualization are equipped with essential features that enhance the data visualization process, ultimately improving data analysis and decision-making. These key features play a crucial role in transforming raw data into meaningful insights. Let’s delve into the key features that define effective BI tools for data visualization.
Data Connectivity and Integration
- BI tools should have the capability to connect to various data sources seamlessly, including databases, cloud storage, and APIs.
- Integration with different data formats and sources ensures that users can access and analyze data from multiple platforms in one centralized location.
- By enabling easy data connectivity, BI tools facilitate the extraction of valuable insights from diverse data sets, leading to more informed decision-making.
Interactive Dashboards
- Interactive dashboards allow users to explore data dynamically, making it easier to identify trends, patterns, and outliers.
- Users can drill down into specific data points, apply filters, and customize visualizations to suit their analytical needs.
- Interactive features such as tooltips, hover effects, and clickable elements enhance user engagement with the data, leading to a more intuitive analysis process.
Advanced Visualizations
- Effective BI tools offer a wide range of visualization options, including charts, graphs, maps, and infographics.
- Advanced visualizations help in presenting complex data sets in a visually appealing and easy-to-understand format.
- By utilizing sophisticated visualizations, users can uncover hidden insights, correlations, and patterns that may not be apparent in raw data.
Collaboration and Sharing Capabilities
- BI tools with collaboration features enable team members to work together on data analysis projects in real-time.
- Users can share insights, reports, and dashboards with colleagues, fostering a culture of data-driven decision-making within the organization.
- Collaboration capabilities streamline the communication of key findings and ensure that all stakeholders are aligned on the data-driven insights.
Best practices for using BI tools for data visualization
When it comes to leveraging BI tools for data visualization, following best practices can significantly enhance the effectiveness of your visualizations and drive better decision-making processes.
Steps for selecting the right BI tool for data visualization
- Identify your specific business needs and objectives for data visualization.
- Research and compare different BI tools based on their features, scalability, and ease of use.
- Consider the compatibility of BI tools with your existing data sources and systems.
- Seek user feedback and reviews to understand the practical usability of each BI tool.
- Opt for a BI tool that offers robust customer support and training resources.
How to prepare data for effective visualization using BI tools
- Cleanse and organize your data to ensure accuracy and consistency.
- Identify relevant data points and metrics that align with your visualization goals.
- Normalize data formats and ensure data quality before importing into BI tools.
- Create data hierarchies and relationships to enable seamless visualization workflows.
- Utilize data modeling techniques to enhance the structure and integrity of your datasets.
Share tips for optimizing the use of BI tools to create insightful visualizations
- Utilize interactive features to allow users to explore data dynamically.
- Experiment with different visualization types to find the most effective representation for your insights.
- Apply color schemes and design principles that enhance the clarity and impact of your visualizations.
- Regularly update and refine your visualizations based on feedback and evolving data trends.
- Collaborate with stakeholders to ensure that visualizations address key business questions and objectives.
In conclusion, mastering BI tools for data visualization can revolutionize how businesses interpret and utilize data for strategic growth. Stay informed, stay empowered, and embrace the power of visual data representation.
When it comes to redefining luxury in sedans with outstanding performance and elegance, the Acura RLX stands out among the competition. With its sleek design and powerful engine, the RLX offers a driving experience like no other.
The Toyota Avalon Limited sets the standard for luxury and performance in the sedan category. Its top-notch features and impressive engine make it the epitome of sophistication on the road.
For those looking for a luxury sedan that combines power and efficiency, the Volvo S90 Recharge is the perfect choice. With its cutting-edge technology and eco-friendly design, the S90 Recharge is redefining what it means to drive in style.